
When performing quantitative PCR (qPCR), there are two primary methods for target detection: dye-based and probe-based detection. In this blog, we will take a deep dive into what is dye-based PCR, a technique invented by Russell Higuchi in the early 1990s1 and remains in daily use in laboratories around the world.
What is dye-based qPCR?
Dye-based qPCR is a cost-effective method for measuring double-stranded DNA amplification during Polymerase Chain Reaction (PCR) through the detection of fluorescence from a DNA binding dye1. This approach requires only the qPCR mix, nuclease-free water, DNA and two sequence-specific primers, making it an economical choice for analysing a large number of targets.
How does dye-based qPCR work?
Dye-based qPCR utilises a DNA binding fluorescent dye which, before binding to the DNa, exhibits low background fluorescence. During the amplification process, the dye binds to the double-stranded DNA products formed in the sample. This binding results in an increase in fluorescence, which is directly proportional to the amount of PCR amplicons produced in each cycle1.
Fluorescence measurements are taken after each PCR cycle. The threshold cycle (Ct), also known as the quantification cycle (Cq), is identified when the fluorescent dye bound to the double-stranded DNA surpasses the background fluorescence level. This Ct value is crucial for quantifying the target DNA in the sample, with lower Ct values indicating a larger quantity of target DNA2,3.
Dye-based qPCR is considered cost-effective because it only requires two sequence-specific primers per target. However, since these primers are the sole determinants of the reaction's specificity, it is not as specific as conventional PCR or probe-based qPCR4. Despite this, it remains significantly cheaper than the need to purchase both primers and probes required for probe-based qPCR.
The primary issue with primers in dye-based qPCR is their tendency to form primer dimers or non-specific amplicons5, 6. Unfortunately, the dye will detect and bind to any double-stranded DNA, including non-specific amplification products. This can lead to inaccurate quantification of the target sequence5.
However, there is a straightforward method to identify this problem. By comparing the melting temperatures of amplification products using melt curves, one can verify the specificity of the amplification and detect the presence of non-specific amplification products6.
Melt curve analysis leverages the fact that different double-stranded DNA strands dissociate at varying temperatures, influenced by factors such as G-C content and single nucleotide polymorphisms (SNPs). Melt curves are generated by heating the PCR product, causing the double-strands to dissociate. During this process, the fluorescent dye also dissociates from the strands, resulting in a detectable drop in fluorescence6.
Once the qPCR machine has finished collecting data, you will receive an amplification plot that visualises the accumulation of DNA throughout the qPCR process. The lines on the plot represent the fluorescent signal from the dye, normalised to the signal of a passive reference dye (such as ROX), and adjusted by subtracting the baseline generated by the qPCR machine2, 3. The plot should look something like this:
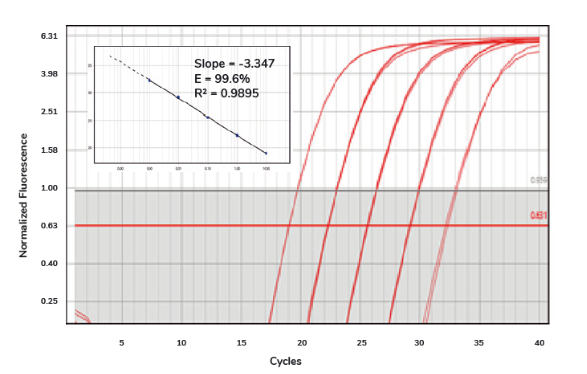
Amplification plot of SolisFAST® SolisGreen® qPCR Mix
What are the pros & cons of dye-based qPCR?
There are many reasons why dye-based qPCR is popular among scientists:
- Cost-effective: requiring only two primers, dye-based qPCR is a more budget-friendly option compared to probe-based qPCR.
- Ease of design: Designing dye-based qPCR is simpler since it only needs two primers. In contrast, probe-based qPCR requires two primers and a specifically placed probe.
- Error detection: Dye-based qPCR can detect non-specific products in addition to the gene of interest, allowing for the optimisation of experiments and improved results in subsequent runs.
Unfortunately, like every method, dye-based qPCR has its limitations and may not be suitable for every experimental design, meaning it has some cons:
- No multiplexing: It is not possible to perform multiplexing with dye-based qPCR.
- Lower specificity: This method has lower specificity compared to probe-based qPCR.
What dye options do you have for dye-based qPCR?
The most crucial component of dye-based qPCR is, naturally, the dye. The PCR experts from Solis BioDyne are on hand to offer some recommendations for choosing the right dye for your qPCR experiment.
The classic and probably most widely used dye is SYBR® Green7. However, there are better options worth considering, even if they are not as popular yet. One such dye is EvaGreen®, which is spectrally similar to SYBR® Green, eliminating the need to change any optical settings when using it8. EvaGreen® is highly stable at room temperature and under PCR conditions8. It allows for higher concentrations to increase fluorescence without disrupting the reaction, facilitating better high-resolution melt analysis8. Additionally, EvaGreen® exhibits less background fluorescence than SYBR® Green I due to its novel “release-on-demand” DNA-binding mechanism9. Moreover, EvaGreen® is considered less toxic and more environmentally friendly than SYBR® Green9.
Another option is SolisGreen®, which also shares spectral properties with other commonly used qPCR dyes. qPCR master mixes based on SolisGreen® dye offer high sensitivity and enhanced performance, with brighter fluorescence even at low target concentrations. This results in improved precision and reduced variance between technical replicates.
Of course, there are many dyes to choose from, but as all Solis BioDyne qPCR products are based on either EvaGreen® or SolisGreen® you can count on good product stability, efficiency and sustainability. Use our product search to explore Solis BioDyne's range of qPCR products.
Inspired by original Solis BioDyne article. Read the original article on their website.
SYBR is a registered trademark of Thermo Fisher Scientific Inc.
References
- Higuchi, R., Fockler, C., Dollinger, G. et al. Kinetic PCR Analysis: Real-time Monitoring of DNA Amplification Reactions. Nat Biotechnol 11, 1026–1030 (1993). https://doi.org/10.1038/nbt0993-1026
- Schefe, J.H., Lehmann, K.E., Buschmann, I.R. et al. Quantitative real-time RT-PCR data analysis: current concepts and the novel “gene expression’s C T difference” formula. J Mol Med 84, 901–910 (2006). https://doi.org/10.1007/s00109-006-0097-6
- Article 5: qPCR data analysis – Amplification plots, Cq and normalisation. (2009). Retrieved 1 November 2021, from https://www.europeanpharmaceuticalreview.com/article/725/article-5-qpcr-data-analysis-amplification-plots-cq-and-normalisation/
- Udvardi, M. K., Czechowski, T., & Scheible, W. R. (2008). Eleven golden rules of quantitative RT-PCR. The Plant cell, 20(7), 1736–1737. https://doi.org/10.1105/tpc.108.061143
- Raso, A., & Biassoni, R. (2014). Twenty Years of qPCR: A Mature Technology? Quantitative Real-Time PCR, 1–3.doi:10.1007/978-1-4939-0733-5_1
- Ririe, K. M., Rasmussen, R. P., & Wittwer, C. T. (1997). Product Differentiation by Analysis of DNA Melting Curves during the Polymerase Chain Reaction. Analytical Biochemistry, 245(2), 154–160.doi:10.1006/abio.1996.9916
- Zipper, H., Brunner, H., Bernhagen, J., & Vitzthum, F. (2004). Investigations on DNA intercalation and surface binding by SYBR Green I, its structure determination and methodological implications. Nucleic acids research, 32(12), e103. https://doi.org/10.1093/nar/gnh101
- Mao, F., Leung, WY. & Xin, X. Characterization of EvaGreen and the implication of its physicochemical properties for qPCR applications. BMC Biotechnol 7, 76 (2007). https://doi.org/10.1186/1472-6750-7-76
- Selvaraj V., Maheshwari Y., Hajeri S., Yokomi R. (2019) Droplet Digital PCR for Absolute Quantification of Plant Pathogens. In: Khurana S., Gaur R. (eds) Plant Biotechnology: Progress in Genomic Era. Springer, Singapore. https://doi.org/10.1007/978-981-13-8499-8_25